- It's really hard to find someone you like who likes you back. So, dating is invariably going to be frustrating and a lot of hard work. Be persistent and you might be rewarded someday.
- Even if you aren't the most attractive person, being sociable and approachable helps improve your chances. It really does.
- Age matters. How it matters, however, is a separate question altogether. Keep this in mind as you search for a romantic connection.
- If you're going to attend dating events, go to facilitated events. Facilitated events work better than unstructured events.

Saturday, 13 September 2014
Data Analytics Wrap-up
We've had five posts on data analytics related to speed dating, and if you haven't had time to read our previous posts, this final post is a summary of all our findings. Based on our data and analysis, our conclusions are:
A Tableau Storyboard on Interests of Participants
Ever been curious about what activities and interests gay men are into? Wonder no more.
In my day job in data analytics, I use and also develop a number of software tools. One of the tools I use is a data visualization software called Tableau.
Today's post will be a little different as it will be much less wordy, and rely on visuals from a Tableau storyboard that I have constructed. So, let's begin.
These are the top 30 interests among participants sorted from most to least popular. By a large margin, the top 3 interests are movies, travelling and listening to music.

Some interests are universal; they have broad appeal across age groups. The top 3 universal interests are listening to music, movies and dining out. If you're on a date, and you find yourself at a loss for conversation topics, talk about any or all of these three things to keep the conversation flowing. Go into specifics to deepen the conversation: artistes, genres, restaurants etc.

Interestingly, across all age groups, the the top 7 interests tend to be fairly similar, but their relative ranking varies significantly by age group. For example, while travelling was the number 2 interest overall and popular with most age groups, it was not a universal interest because it did not figure in the top 7 for the under-25 age group. The under-25 age group was the only age group that did not find travelling important.


In my day job in data analytics, I use and also develop a number of software tools. One of the tools I use is a data visualization software called Tableau.
Today's post will be a little different as it will be much less wordy, and rely on visuals from a Tableau storyboard that I have constructed. So, let's begin.
These are the top 30 interests among participants sorted from most to least popular. By a large margin, the top 3 interests are movies, travelling and listening to music.
Some interests are universal; they have broad appeal across age groups. The top 3 universal interests are listening to music, movies and dining out. If you're on a date, and you find yourself at a loss for conversation topics, talk about any or all of these three things to keep the conversation flowing. Go into specifics to deepen the conversation: artistes, genres, restaurants etc.
Interestingly, across all age groups, the the top 7 interests tend to be fairly similar, but their relative ranking varies significantly by age group. For example, while travelling was the number 2 interest overall and popular with most age groups, it was not a universal interest because it did not figure in the top 7 for the under-25 age group. The under-25 age group was the only age group that did not find travelling important.
Here are the top 7 interests for each age group.
There are some discernible patterns in how interests vary with age. Here are 5 examples.
Interestingly, team sports are much less popular than individual sports. Maybe gay men just didn't get into the whole male bonding thing back in school. Perhaps some of us were less athletic in our youth, and ended up being the proverbial last kid that's picked for a team; ergo, the lifelong aversion to team sports.
Tuesday, 9 September 2014
Do Age and Common Interests Matter?
When I first devised my seating algorithm, the prime consideration was coming up with an algorithm that could avoid seating arrangements where participants would meet someone they already knew or had speed dated previously. The secondary consideration was optimizing the seating arrangement so that people whom I thought were more likely to connect would meet each other on a speed date. I designed the seating algorithm to minimize the age difference while maximizing the number of mutual interests between participants who speed dated each other.
Naturally, I wanted to verify whether this hypothesis of age difference and mutual interests actually mattered when it came to improving the chances of a match. I analyzed the data in the following way:
More importantly, and this may come as a surprise to some of you, the incidence of matches that occur between guys who mingle but do not speed date each other is actually very, very low. Across all 3 events I have held, there are only been 5 such matches. The low number of such matches precludes any credible analysis. In contrast, there have been 18 matches between speed dating pairs.
Now, let’s look at what I found from the analysis.
Age Difference
As it turns out, there is a difference in average age difference across the groups. The chart below shows that the age difference is significantly smaller in the matches group as compared to the speed dating or expressions of interest groups.

A less thorough analysis would conclude here that the smaller the age difference between a dating pair, the more likely they are to match. That would be a premature conclusion however.
One thing that stood out while I was organizing events was the age distribution of participants who come to 7for7 events. The majority of participants who attend my events are in the 20-40 age group. Only about 20% of participants are in the above 40 age group. This distribution of ages, however, is not preserved when we look at the matches group. The chart below shows the data.

When we move from the speed dating group to the matches group, the proportion of participants above the age of 40 halves. Only about 10% of participants with a match are above the age of 40. Obviously, since the above-40 group accounts for a lower proportion of the matches group, the 20-30 and 30-40 age groups must take up a correspondingly larger proportion in the matches group.
The increase is greatest for the 20-30 age group: an increase from 36% to 42% represents an increase of 17% (we’re taking ratios here, not absolute differences). The increase is more muted for the 30-40 age group (44% to 47% represents a 7% increase).
So, what does all this mean?
It means that it is age itself, rather than the age difference, that is the important factor in explaining the smaller absolute age difference in the matches group as compared to the speed dating or expressions of interest groups. Older guys receive disproportionately fewer matches compared to the younger guys, particularly those in their 20s, and that means that guys in the matches group are generally younger guys matching up with each other. This is confirmed when I plot the same age difference data not as a simple column chart, but as a box plot, shown below.

The distribution of age differences gets tighter as we move from the speed dating group, to the expressions of interest group, to the matches group. For those who need a primer on what box plots are, here’s the Wikipedia entry.
I hate to sound ageist when I say that age matters, but the data is the data. [And as for those who like to claim that age is "just a number"...well, my numbers - the data I have collected, say otherwise.] While age matters, how and why it matters is a completely different question altogether. One that I cannot answer definitively with the data I have.
There could be a plethora of reasons why age matters. Maybe older guys are clearer in their minds what they’re looking for, so they tend to be more selective and receive fewer matches as a result.
Maybe the older guys who come to my events are less physically attractive; age certainly affects how a person looks. In which case, the difference that I am observing in the data has less to do with age than with youth and physical attractiveness. Age is simply a proxy indicator.
Or maybe things work pretty much the same in the gay world as they do in the straight world. Guys, no matter their age, prefer to date youthful partners. Straight men well into their 50s still prefer the company of younger women in their 20s rather than someone closer to their own age. Gay men might well be the same.
If you are above the age of 40 and reading this, I am not discriminating against you. Frankly, I'm not that far off from the big 4-O myself. I am interpreting what I see in the data.
Does this mean that if you're above 40, you shouldn't attend speed dating events? No. There are lots of reasons why you might choose not to attend speed dating events, but this shouldn't be one of them. That would be like blaming the mirror for why you look the way you do. Also, the data above shows that guys in their 40s can still get matches, albeit at a lower frequency.
Mutual Interests
It may seem counterintuitive, but my data showed that the number of mutual interests didn’t seem to matter. We would expect that the number of mutual interests would increase going from the speed dating group to the expressions of interest group to the matches group. In fact, there was little discernible difference in the average number of mutual interests between the three groups.
I can think of a number of reasons to explain this counterintuitive result:
Naturally, I wanted to verify whether this hypothesis of age difference and mutual interests actually mattered when it came to improving the chances of a match. I analyzed the data in the following way:
- I looked at the pairs of participants who speed dated each other. For each pair, I calculated the absolute age difference and the number of mutual interests between them.
- Across all speed dating pairs, I calculated the average absolute age difference and the average number of mutual interests.
- I repeated the procedure in (1) and (2) separately for two subsets of the pairs of participants who speed dated each other:
- Those pairs where only one participant was interested in the other (I call this the “expressions of interest” group).
- Those pairs where both participants were interested in each other, resulting in a match (the “matches” group).
- Finally, I compared the average absolute age difference and the average number of mutual interests across the three groups: the speed dating group, the “expressions of interest” group, and the matches group.
More importantly, and this may come as a surprise to some of you, the incidence of matches that occur between guys who mingle but do not speed date each other is actually very, very low. Across all 3 events I have held, there are only been 5 such matches. The low number of such matches precludes any credible analysis. In contrast, there have been 18 matches between speed dating pairs.
Now, let’s look at what I found from the analysis.
Age Difference
As it turns out, there is a difference in average age difference across the groups. The chart below shows that the age difference is significantly smaller in the matches group as compared to the speed dating or expressions of interest groups.
A less thorough analysis would conclude here that the smaller the age difference between a dating pair, the more likely they are to match. That would be a premature conclusion however.
One thing that stood out while I was organizing events was the age distribution of participants who come to 7for7 events. The majority of participants who attend my events are in the 20-40 age group. Only about 20% of participants are in the above 40 age group. This distribution of ages, however, is not preserved when we look at the matches group. The chart below shows the data.
When we move from the speed dating group to the matches group, the proportion of participants above the age of 40 halves. Only about 10% of participants with a match are above the age of 40. Obviously, since the above-40 group accounts for a lower proportion of the matches group, the 20-30 and 30-40 age groups must take up a correspondingly larger proportion in the matches group.
The increase is greatest for the 20-30 age group: an increase from 36% to 42% represents an increase of 17% (we’re taking ratios here, not absolute differences). The increase is more muted for the 30-40 age group (44% to 47% represents a 7% increase).
So, what does all this mean?
It means that it is age itself, rather than the age difference, that is the important factor in explaining the smaller absolute age difference in the matches group as compared to the speed dating or expressions of interest groups. Older guys receive disproportionately fewer matches compared to the younger guys, particularly those in their 20s, and that means that guys in the matches group are generally younger guys matching up with each other. This is confirmed when I plot the same age difference data not as a simple column chart, but as a box plot, shown below.
The distribution of age differences gets tighter as we move from the speed dating group, to the expressions of interest group, to the matches group. For those who need a primer on what box plots are, here’s the Wikipedia entry.
I hate to sound ageist when I say that age matters, but the data is the data. [And as for those who like to claim that age is "just a number"...well, my numbers - the data I have collected, say otherwise.] While age matters, how and why it matters is a completely different question altogether. One that I cannot answer definitively with the data I have.
There could be a plethora of reasons why age matters. Maybe older guys are clearer in their minds what they’re looking for, so they tend to be more selective and receive fewer matches as a result.
Maybe the older guys who come to my events are less physically attractive; age certainly affects how a person looks. In which case, the difference that I am observing in the data has less to do with age than with youth and physical attractiveness. Age is simply a proxy indicator.
Or maybe things work pretty much the same in the gay world as they do in the straight world. Guys, no matter their age, prefer to date youthful partners. Straight men well into their 50s still prefer the company of younger women in their 20s rather than someone closer to their own age. Gay men might well be the same.
If you are above the age of 40 and reading this, I am not discriminating against you. Frankly, I'm not that far off from the big 4-O myself. I am interpreting what I see in the data.
Does this mean that if you're above 40, you shouldn't attend speed dating events? No. There are lots of reasons why you might choose not to attend speed dating events, but this shouldn't be one of them. That would be like blaming the mirror for why you look the way you do. Also, the data above shows that guys in their 40s can still get matches, albeit at a lower frequency.
Mutual Interests
It may seem counterintuitive, but my data showed that the number of mutual interests didn’t seem to matter. We would expect that the number of mutual interests would increase going from the speed dating group to the expressions of interest group to the matches group. In fact, there was little discernible difference in the average number of mutual interests between the three groups.
I can think of a number of reasons to explain this counterintuitive result:
- People don’t take the information they provide on their interests and activities seriously when they fill up the registration form. For example, something like a third of all guys put down board games as an activity, but in my experience, very few people actually regularly play board games. This is essentially a problem with bad data.
- Just because people have activities in common doesn’t mean they will hit it off on the basis of those activities. It depends on what kinds of activities we're talking about.
For example, something like 50% of the guys who register on my website indicate “gym” as an activity. But if you’re a gay man, going to the gym regularly is practically a necessity of the gay condition. Many guys genuinely enjoy going to the gym, but an even larger number go to the gym because they feel they have to build a body that will garner some attention. It’s probably not likely that guys will bond over an activity that is regarded as a chore by some. - Some interests are so banal as to render them useless in predicting attraction between dates. For example, listening to music, movies and dining out are the top 3 activities. More than three quarters of participants indicated interest in these activities. Come to think of it, they're probably the top 3 activities of Singaporeans in general.
- I collect data on activities and interests that participants claim they engage in (whether or not they actually engage in these activities is a separate question altogether). I do not, however, collect data on the intensity of these interests and activities.
Based on my analysis of the data, most guys list too many activities rather than their most important activities and interests. In retrospect, I should have limited the number of activities and interests that registrants could select to perhaps their top 5.
It seems more likely for two guys who have 1 deep mutual interest (particularly if it is an unusual or uncommon interest) to hit it off than if they had 10 shallow mutual interests. This reason is probably the likeliest one for the number of mutual interests to apparently not have an impact on the probability of a match.
A more detailed post on the interests of participants, and by extension, single gay men, will follow next week.
Saturday, 30 August 2014
The Speed Dating Value-Add
In a speed dating event, you meet dates that the organizer has arranged for you. In a singles mixer, you are free to mingle with and speak to anyone you wish.
When it comes to matching up with guys that you might be interested in, is there a difference between a speed dating event and a casual singles mixer?
That was a question that I asked myself when I first started 7for7. A speed dating event is a whole lot of work to organize. There are participants to confirm registration for, seating arrangements to devise, program sheets to print out, matches to coordinate at the end of an event...Quite frankly, a singles mixer is a lot less preparation. It can accommodate walk-ins, and it's also more profitable since I can pack in as many guys as the venue can hold.
So, why do I organize speed dating events?
Because I had a hunch that they work better than casual mixers. And I set out to collect data to verify that hypothesis. This post is about how speed dating improves your chances of getting matches as compared to just attending a mixer event.
Let's start with a diagram.

Let's take our gold-colored guy in the diagram as an example: "John".
When I hold a speed dating event for 20 guys, John meets with 7 other guys on a speed date: the guys in blue. Now, John attended the event with a friend, whom he has no romantic inclinations toward. John's friend is the green guy.
Aside from John, his friend and John's 7 speed dates, there are 11 other guys who are also participating in the event: the guys in black. John doesn't meet these guys on his speed dates, but he can meet with them during the mingling after the speed dating portion of the event.
Now, John can express interest in any of the guys who attend the event, not just those he speed dated. Because he has 1 friend whom he knows, 7 speed dates and 11 other participants, we can expect that all other things being equal, the proportion of guys he's interested in should be, on average, 1:7:11, in the order of his friend, speed dates and other participants. That is, we would expect that the number of "other participants" that John would be interested in would be about 11/7 times the number of "speed dates" that he's interested in.
All other things being equal of course.
Now of course, John probably isn't very interested in his friend. And he might actually leave the event without being interested in anyone at all. The ratio of 1:7:11 is just an expected proportion. John obviously can't be interested in fractional guys.
But, I can do the same proportioning for every guy who attends my event. More generally, I can count, across all the events I have held, the number of possible "expressions of interest" in speed dates, other participants, and the "declined": those guys that participants at my event have told me specifically that they do not wish to speed date (usually because they already know each other).
Based on data I have collected, this is the theoretical distribution of expressions of interest.

As can be expected, the greatest theoretical share of expressions of interest belongs to other participants. After all, there can be up to 20 participants at one event, but each guy only speed dates 7 guys; there can be up to 12 other participants he doesn't speed date. The smallest share goes to declined, which is also expected, since most guys attend my events with at most 1 or 2 friends.
This theoretical distribution is premised on all other things being equal. If speed dating adds no value as compared to a casual singles mixer, we would expect the actual distribution of expressions of interest to look very similar to the theoretical distribution.
In fact, the actual distribution of expressions of interest looks like this:

Clearly, the vast majority of expressions of interest is actually between guys who speed date each other. So, speed dating does make a difference.
Do note that this disparity between theoretical and actual distributions is not due to participants having spent more time speed dating instead of mixing with other participants.
If you have ever attended a 7for7 event, you would know that I specifically budget slightly more than 1 hour for mingling. This is intended by design. The speed dating portion of the event takes up just 50 minutes. I wanted to ensure that participants had more than enough time to mingle around so that a fair comparison could be made between speed dating and mingling.
Now of course, the design of the experiment is not perfect. The optimal experimental design would involve me holding separate speed dating-only events and casual mixer-only events, and comparing results between the two. But as it is, getting enough participants is already a challenge, which is why I blended the two kinds of events.
There are other caveats when interpreting the results:
The next logical question to ask then is, assuming you were interested in someone after a speed date, what's the likelihood that they are interested in you back? That is, what percentage of expressions of interest arising from speed dating become matches? And how does this percentage compare to expressions of interest that arise from casual mingling instead?
Here's the data:

If you are interested in someone that you met while mingling, the probability of him being interested in you back is 13%. In contrast, for a speed date you're interested in, the probability of him being interested in you back is a significantly higher 19%.
Remember, this is the proportion of expressions of interest that turn into matches. So, irrespective of how likely you are to be interested in someone you speed date versus someone you mingle with, the chances of someone you are interested in being interested in you back are still higher for a speed date as opposed to a casual meeting during the mingling. Much higher in fact, almost by half.
I've refrained from showing the raw data thus far, but now is a good time to mention it. Across all 3 events that I have held, there have been 18 matches that resulted from speed dates. In contrast, there have been only 5 matches that resulted between participants who did not speed date each other. The contrast is quite remarkable when you consider that despite the larger amount of time that I allocate for mingling and the far larger number of guys that each participant can meet while mingling as compared to speed dating, the number of matches that result is fewer than half.
So, what's the conclusion? The conclusion that I draw from the data is this: in terms of getting you matches, facilitated events such as speed dating work much better than unstructured events like singles' mixers.
A facilitated event need not be a speed dating event. It could be a small group of guys at a party hosted by one of your friends who's trying to introduce you to other friends of his. The point here is this: a little bit of facilitation that promotes conversation between guys who would not normally approach each other of their own volition is a good thing.
In retrospect, it's hardly a surprise that facilitated events work better than unstructured events. I have a very good straight friend who attends singles' meet-ups, and according to him, the few hot girls who attend the event invariably get surrounded and buttonholed by many guys, while the less attractive girls (who may be perfectly decent looking, just not as hot) get ignored.
I imagine the same would occur for gay men attending such events. Going to singles' mixers works well if you are very good-looking and attractive. But if you are very good-looking and attractive, online dating on gay apps like jack'd probably works just as well; you get lots of messages without stepping outside the house.
For those of you who are less confident of your looks, facilitated events are probably going to work better for you than mixers or online dating.
When it comes to matching up with guys that you might be interested in, is there a difference between a speed dating event and a casual singles mixer?
That was a question that I asked myself when I first started 7for7. A speed dating event is a whole lot of work to organize. There are participants to confirm registration for, seating arrangements to devise, program sheets to print out, matches to coordinate at the end of an event...Quite frankly, a singles mixer is a lot less preparation. It can accommodate walk-ins, and it's also more profitable since I can pack in as many guys as the venue can hold.
So, why do I organize speed dating events?
Because I had a hunch that they work better than casual mixers. And I set out to collect data to verify that hypothesis. This post is about how speed dating improves your chances of getting matches as compared to just attending a mixer event.
Let's start with a diagram.
Let's take our gold-colored guy in the diagram as an example: "John".
When I hold a speed dating event for 20 guys, John meets with 7 other guys on a speed date: the guys in blue. Now, John attended the event with a friend, whom he has no romantic inclinations toward. John's friend is the green guy.
Aside from John, his friend and John's 7 speed dates, there are 11 other guys who are also participating in the event: the guys in black. John doesn't meet these guys on his speed dates, but he can meet with them during the mingling after the speed dating portion of the event.
Now, John can express interest in any of the guys who attend the event, not just those he speed dated. Because he has 1 friend whom he knows, 7 speed dates and 11 other participants, we can expect that all other things being equal, the proportion of guys he's interested in should be, on average, 1:7:11, in the order of his friend, speed dates and other participants. That is, we would expect that the number of "other participants" that John would be interested in would be about 11/7 times the number of "speed dates" that he's interested in.
All other things being equal of course.
Now of course, John probably isn't very interested in his friend. And he might actually leave the event without being interested in anyone at all. The ratio of 1:7:11 is just an expected proportion. John obviously can't be interested in fractional guys.
But, I can do the same proportioning for every guy who attends my event. More generally, I can count, across all the events I have held, the number of possible "expressions of interest" in speed dates, other participants, and the "declined": those guys that participants at my event have told me specifically that they do not wish to speed date (usually because they already know each other).
Based on data I have collected, this is the theoretical distribution of expressions of interest.
As can be expected, the greatest theoretical share of expressions of interest belongs to other participants. After all, there can be up to 20 participants at one event, but each guy only speed dates 7 guys; there can be up to 12 other participants he doesn't speed date. The smallest share goes to declined, which is also expected, since most guys attend my events with at most 1 or 2 friends.
This theoretical distribution is premised on all other things being equal. If speed dating adds no value as compared to a casual singles mixer, we would expect the actual distribution of expressions of interest to look very similar to the theoretical distribution.
In fact, the actual distribution of expressions of interest looks like this:
Do note that this disparity between theoretical and actual distributions is not due to participants having spent more time speed dating instead of mixing with other participants.
If you have ever attended a 7for7 event, you would know that I specifically budget slightly more than 1 hour for mingling. This is intended by design. The speed dating portion of the event takes up just 50 minutes. I wanted to ensure that participants had more than enough time to mingle around so that a fair comparison could be made between speed dating and mingling.
Now of course, the design of the experiment is not perfect. The optimal experimental design would involve me holding separate speed dating-only events and casual mixer-only events, and comparing results between the two. But as it is, getting enough participants is already a challenge, which is why I blended the two kinds of events.
There are other caveats when interpreting the results:
- Some participants leave right after the speed dating portion of the event, not staying to mingle. This would naturally diminish the number of expressions of interest in the "other participants" group. But the number of such participants is generally small.
- The seating arrangement for 7for7 is not random, but devised by an algorithm that minimizes age differences while maximizing common interests. It's an open question whether it is my algorithm that is increasing the proportion of expressions of interest coming from speed dating, or the nature of speed dating itself.
The next logical question to ask then is, assuming you were interested in someone after a speed date, what's the likelihood that they are interested in you back? That is, what percentage of expressions of interest arising from speed dating become matches? And how does this percentage compare to expressions of interest that arise from casual mingling instead?
Here's the data:
If you are interested in someone that you met while mingling, the probability of him being interested in you back is 13%. In contrast, for a speed date you're interested in, the probability of him being interested in you back is a significantly higher 19%.
Remember, this is the proportion of expressions of interest that turn into matches. So, irrespective of how likely you are to be interested in someone you speed date versus someone you mingle with, the chances of someone you are interested in being interested in you back are still higher for a speed date as opposed to a casual meeting during the mingling. Much higher in fact, almost by half.
I've refrained from showing the raw data thus far, but now is a good time to mention it. Across all 3 events that I have held, there have been 18 matches that resulted from speed dates. In contrast, there have been only 5 matches that resulted between participants who did not speed date each other. The contrast is quite remarkable when you consider that despite the larger amount of time that I allocate for mingling and the far larger number of guys that each participant can meet while mingling as compared to speed dating, the number of matches that result is fewer than half.
So, what's the conclusion? The conclusion that I draw from the data is this: in terms of getting you matches, facilitated events such as speed dating work much better than unstructured events like singles' mixers.
A facilitated event need not be a speed dating event. It could be a small group of guys at a party hosted by one of your friends who's trying to introduce you to other friends of his. The point here is this: a little bit of facilitation that promotes conversation between guys who would not normally approach each other of their own volition is a good thing.
In retrospect, it's hardly a surprise that facilitated events work better than unstructured events. I have a very good straight friend who attends singles' meet-ups, and according to him, the few hot girls who attend the event invariably get surrounded and buttonholed by many guys, while the less attractive girls (who may be perfectly decent looking, just not as hot) get ignored.
I imagine the same would occur for gay men attending such events. Going to singles' mixers works well if you are very good-looking and attractive. But if you are very good-looking and attractive, online dating on gay apps like jack'd probably works just as well; you get lots of messages without stepping outside the house.
For those of you who are less confident of your looks, facilitated events are probably going to work better for you than mixers or online dating.
Monday, 25 August 2014
Who Gets Matched Up at 7for7 Events?
I've held 3 events so far, and about 50 participants have attended my events. Only a few participants have attended 2 events, none all 3. Some of you have received matches, some of you have not. This post is about who gets matched up at an event, and how you can improve your chances of getting matches in future events.
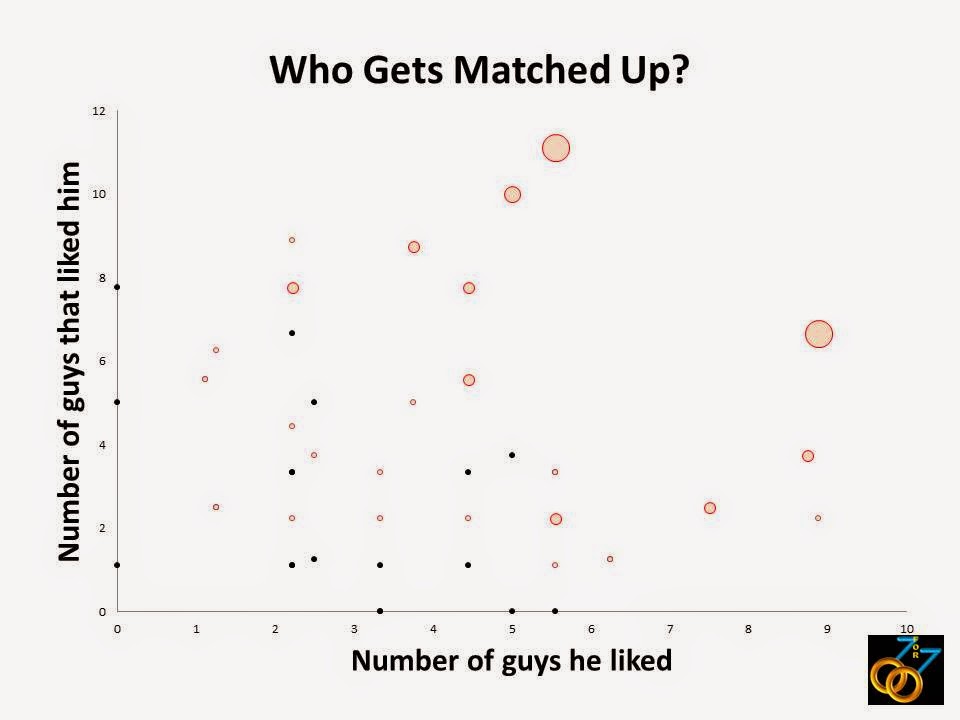
Let's start with with a chart.

At every event, every participant indicates on their program sheet who they are interested in. In the chart above, every black dot represents a participant. On the x-axis is the number of participants he indicated interest in. On the y-axis is the number of participants who indicated interest in him.
Right now, the chart isn't very interesting. It's just a scatter of black dots. So, let's add more information. The chart below is exactly the same as the one above, except that participants who received matches are shown as red circles instead of black dots. The size of the circle is proportionate to the number of matches the participant received. Large red circles represent participants who received many matches.
The chart above shows more of a pattern, but to make things even easier to see, let's divide the chart up into 4 quadrants.

Now let's name each of the 4 quadrants.

If you haven't already guessed, the names are descriptive of each of the quadrants. Snow Queens tend to be popular, but are selective with who they are interested in. Butterflies are the opposite; they're very sociable and are interested in several guys, but tend not to be so popular themselves. Wallflowers tend not to make their presence felt during the event; they aren't interested in many guys and vice versa. Belles of the Ball are exactly that: popular, sociable...they never go home empty-handed.
Now, please note that while every participant falls into a quadrant, in no way am I judging anyone for which quadrant they fall into. Where you fall into a quadrant depends not just on you, but also on what everyone else does at the event. For example, if everyone at an event was a Butterfly, all the Butterflies would transform into Belles of the Ball simply due to group interactions.
The reason why I divided participants into these 4 quadrants was to try and understand how being attractive and being sociable at an event affects how many matches a participant gets.
Below is the chart showing a summary of results for each of the 4 quadrants. The left y-axis shows the percentage of participants in each quadrant who go home with at least 1 match. The right y-axis shows the average number of matches for participants in each quadrant who have at least 1 match.

Looking at this chart, some things become clear. Wallflowers unsurprisingly don't get many matches. Every other quadrant does significantly better at receiving at least 1 match.
What is a bit more unexpected is that while the Snow Queens are popular with many guys, they only do marginally better than the Butterflies in terms of the probability of getting at least one match and the average number of matches they get. As it turns out, a Snow Queen may be good-looking, have a great body, be popular...but that is no guarantee that the few guys he's interested in are interested in him back. The Butterflies do almost as well as the Snow Queens by being sociable and open to meeting many guys. For a Snow Queen, being selective may be about knowing what you're looking for, but it certainly narrows the field down quite a bit.
The Belles of the Ball do the best at events, again unsurprisingly. What may come as a surprise is how much better they actually do compared to other participants. No Belle of the Ball ever leaves an event without a match, and quite often, they leave with multiple matches. Being attractive is well and good, but being sociable and approachable at an event makes things even better for them.
So, what percentage of participants fall into each of the 4 quadrants? See the chart below.

Belles of the Ball are rare, Snow Queens and Butterflies are about equally represented, and the largest group are the Wallflowers.
So, at this point, you might be asking, what does this all mean for me?
The primary takeaway that I want participants to understand is that attending a dating event is not about screening guys for a potential soulmate. It's about being open to the possibility of chemistry with someone else.
While every person is selective about what they are looking for, it makes sense to be selective only about the things most important to you. If you are very selective about many things, that is certainly your prerogative, but you should understand that the odds of a match will be correspondingly lower, just as they are for the Snow Queens and the Wallflowers. As event organizer, I create the space for interactions; what happens in that space is entirely up to you.
Let's start with with a chart.
Right now, the chart isn't very interesting. It's just a scatter of black dots. So, let's add more information. The chart below is exactly the same as the one above, except that participants who received matches are shown as red circles instead of black dots. The size of the circle is proportionate to the number of matches the participant received. Large red circles represent participants who received many matches.
The chart above shows more of a pattern, but to make things even easier to see, let's divide the chart up into 4 quadrants.
Now let's name each of the 4 quadrants.
- Upper Left Hand Quadrant: Snow Queens (represented by Elsa from the movie Frozen)
- Upper Right Hand Quadrant: Belles of the Ball (represented by Belle from Beauty and the Beast)
- Lower Right Hand Quadrant: Butterflies
- Lower Left Hand Quadrant: Wallflowers
If you haven't already guessed, the names are descriptive of each of the quadrants. Snow Queens tend to be popular, but are selective with who they are interested in. Butterflies are the opposite; they're very sociable and are interested in several guys, but tend not to be so popular themselves. Wallflowers tend not to make their presence felt during the event; they aren't interested in many guys and vice versa. Belles of the Ball are exactly that: popular, sociable...they never go home empty-handed.
Now, please note that while every participant falls into a quadrant, in no way am I judging anyone for which quadrant they fall into. Where you fall into a quadrant depends not just on you, but also on what everyone else does at the event. For example, if everyone at an event was a Butterfly, all the Butterflies would transform into Belles of the Ball simply due to group interactions.
The reason why I divided participants into these 4 quadrants was to try and understand how being attractive and being sociable at an event affects how many matches a participant gets.
Below is the chart showing a summary of results for each of the 4 quadrants. The left y-axis shows the percentage of participants in each quadrant who go home with at least 1 match. The right y-axis shows the average number of matches for participants in each quadrant who have at least 1 match.
Looking at this chart, some things become clear. Wallflowers unsurprisingly don't get many matches. Every other quadrant does significantly better at receiving at least 1 match.
What is a bit more unexpected is that while the Snow Queens are popular with many guys, they only do marginally better than the Butterflies in terms of the probability of getting at least one match and the average number of matches they get. As it turns out, a Snow Queen may be good-looking, have a great body, be popular...but that is no guarantee that the few guys he's interested in are interested in him back. The Butterflies do almost as well as the Snow Queens by being sociable and open to meeting many guys. For a Snow Queen, being selective may be about knowing what you're looking for, but it certainly narrows the field down quite a bit.
The Belles of the Ball do the best at events, again unsurprisingly. What may come as a surprise is how much better they actually do compared to other participants. No Belle of the Ball ever leaves an event without a match, and quite often, they leave with multiple matches. Being attractive is well and good, but being sociable and approachable at an event makes things even better for them.
So, what percentage of participants fall into each of the 4 quadrants? See the chart below.
Belles of the Ball are rare, Snow Queens and Butterflies are about equally represented, and the largest group are the Wallflowers.
So, at this point, you might be asking, what does this all mean for me?
The primary takeaway that I want participants to understand is that attending a dating event is not about screening guys for a potential soulmate. It's about being open to the possibility of chemistry with someone else.
While every person is selective about what they are looking for, it makes sense to be selective only about the things most important to you. If you are very selective about many things, that is certainly your prerogative, but you should understand that the odds of a match will be correspondingly lower, just as they are for the Snow Queens and the Wallflowers. As event organizer, I create the space for interactions; what happens in that space is entirely up to you.
Tuesday, 12 August 2014
How Hard is it to Get a Match at a 7for7 Event?
Let's start with a refresher on the basics of probability and combinatorics. For those of you who were bad at math back in school, I promise to go easy on you. :o)
Here's a very simple example.

Here's a very simple example.
If you were offered 4 colored blocks, and you could choose any 2, how many different ways could you choose your pair of colored blocks?
The answer is 6. There are 6 different ways of choosing 2 out of 4 blocks.
Now, if you had 20 guys in a room at a gay dating event, how many possible combinations of couples could you have?
....
I'll save you the suspense. There are a total of 190 different couple combinations. So, theoretically speaking, when I hold a 7for7 event, there could up to 190 matches. Fewer if the number of participants is less than 20. Of course, we never ever even remotely approach that number of matches. So, how many matches do I actually record at every event? You can see the numbers below:

In practice, the total number of matches is very low, as seen in the table above. If we take the total number of matches divided by the total possible number of matches, we end up with a crude estimate of how likely it is for two people to hit it off together. Something like an average probability of 6%.
In reality, the number is even lower for most people, because the good-looking and attractive guys who attend my events go home with multiple matches. These guys skew the average upwards. The probability of a match for an average looking guy with an average personality is probably in the range of about 3%.
We all knew it was challenging finding someone you liked who liked you back, at least enough for a second date. Well, my data is telling you exactly how challenging it is. The odds are 17-1 against.
When I first presented this to the organizers of Indignation when I was pitching the idea of a talk, I was told this rather depressing figure wasn't something I should show, because it would discourage people from attending my events.
I didn't say it then, but I thought that the idea of not showing the data was insane.
The low probability of a match isn't the fault of speed dating; it's a reflection of the fact that it's really hard to find someone compatible. Whether you choose to attend a dating event or not doesn't change that fact. And attending a dating event is not an either-or proposition; just because you go to a dating event doesn't mean you can't also do online dating, ask friends for introductions, go to a gay bar or cruise at the gym. So, the low probability of a match is no reason to not go to a dating event, because it isn't a phenomenon peculiar to a dating event.
In fact, I would argue that the low probability of a match is precisely why people should attend dating events. Again, we'll have to turn to the numbers to get the story.
For any given pair of guys at a 7for7 event, the probability of a match, as stated above, is very low, standing at about 6%. But the probability of a participant who attends a 7for7 event going home with at least one match is actually quite good. Better than 50%!

The chance of hitting it off with one particular guy is only about 6%, but the chance of hitting it off with at least one guy when you meet a whole bunch of guys at an event is ten times better: 60%.
This again reflects the fact that dating is inherently a numbers game. And a dating event is the most efficient way to actually meet, in person, many new guys. The more guys you meet, the more guys you'll find yourself interested in, and the more likely you will go home with at least one match.
This again reflects the fact that dating is inherently a numbers game. And a dating event is the most efficient way to actually meet, in person, many new guys. The more guys you meet, the more guys you'll find yourself interested in, and the more likely you will go home with at least one match.
When you consider the low probability of making a match, it makes sense to go to a dating event where you get the chance to meet many gay, single and relationship-oriented individuals. It's like buying multiple lottery tickets; you're more likely to walk away with a prize than if you just bought one ticket (meaning you went on a one-on-one date with a prospect).
And remember, the low probability of a match that I have estimated above is in the context of a dating event, which as I have mentioned, involves gay, single and relationship-oriented individuals.
What's the probability that you'll meet someone gay, single and relationship-oriented in the normal context of your life? And that both of you happen to be compatible with each other?
In all likelihood, much, much lower.
And if you're closeted? Practically zero.
New Series of Interest Posts - Dating Analytics

Now OkTrends has restarted after a long hiatus (Christian Rudder, the founder, took time out to write his forthcoming book on dating analytics, Dataclysm). And his first new post on OkTrends is a doozy. In his post, he talks about, among other things, the importance of pictures versus the words you fill in your online dating profile.
*Spoiler Alert*:
Your picture is worth the proverbial thousand words, but your actual words are worth...nothing. Sad, but true, and also unsurprising. But hey, at least someone has proven this for a fact.
I encourage everyone to read his post in full, especially if you use any online dating websites or apps.
In the spirit of OkTrends' resurrection, after holding 3 events successfully, I've collected enough data to make some interesting observations. Granted, the sample size is small, but I have to start somewhere.
Originally, I had planned on giving a talk on my insights into dating as part of Indignation 2014. This was the side project I mentioned several weeks ago. However, the organizers of Indignation weren't too enthused about the idea of a talk with statistics and numbers. They offered to help publicize the next 7for7 event instead, but based on data from Google Analytics, there were only about 60 visitors to my blog who linked from Indignation's Facebook page. Just one or two registered on my website (I track that data too).
Given the limited reach of Indignation, I won't be pursuing the idea of giving a talk. Instead, I've repurposed my presentation as a series of interest posts to be released over the next few weeks. Each post will center on a particular insight or observation that I've gleaned over the course of organizing events.
Now, while enjoying reading my witty and trenchant observations may be well and good for some folks, I understand that some people will want more than that, and indeed, my goal is to offer something for you, as an individual trying to date, that will help you get a better experience out of dating in general. And to that end, this entire series of posts is geared towards offering advice or things to consider as you navigate the jungle that is gay dating.
Subscribe to:
Posts (Atom)